New Corruption Forecast Gives Powerful Tools to Corruption Fighters & Global Investors
Over the past few months, the world has witnessed the harrowing consequences of aggressive, corruption-fueled authoritarianism. Barely three months after the United States hosted the world’s first Summit for Democracy —and named fighting corruption a central pillar of U.S. strategy—the invasion of Ukraine by Russia has been a wake-up call for democracies and businesses committed to the rule of law. At this critical point in history, a new set of tools is needed for tracking, analyzing, and predicting corruption trends around the world. Now we have one: The Corruption Risk Forecast (CRF).
In collaboration with the pioneering academic Alina Mungiu-Pippidi, who directs the European Research Centre for Anti-Corruption and State-Building (ERCAS), the Center for International Private Enterprise (CIPE) launched the CRF in April. Consolidating a vast array of granular public data, the CRF provides three dashboards or “panes of glass” into the state of corruption around the world. These include a corruption index (the Index for Public Integrity, or IPI), a new country-by-country indicator for transparency (the Transparency Index), and the forward-looking Corruption Risk Forecast.
These tools are already garnering attention, including a recent Open Government Partnership blog, a widely shared post on the FCPA Blog announcing the new tool, and a second FCPA blog post offering a critique of the new forecast’s statistical methodology. This critique, which centers on whether the new forecast should use zero or average global change as a baseline for statistical significance, is addressed by the CRF’s methodology section.
The CRF’s focus on changes within countries due to corruption constraints and opportunities aligns with a statistical baseline (or “null hypothesis”) of zero change. The alternative would lead to confusing results. For example, take a hypothetical increase in a country’s press freedom evidenced by several new prominent newspapers that regularly publish critiques of government decisions. Assuming the change is above a certain threshold (again, see methodology), the CRF considers it a significant new constraint on public corruption. On the other hand, a baseline of average global change would consider such a change to be irrelevant if the dataset’s average country showed a similar increase in press freedoms. Thus, in its choice of methodology, the CRF asserts that each country’s corruption constraints matter independently of what is happening in other countries.
Methodology questions aside, the tools available on the new website deserve a more detailed introduction for those who are still unfamiliar with them. Here is a brief look at each of the CRF’s three corruption risk dashboards.
The Balance of Public Integrity
The Index for Public Integrity, or IPI, provides a snapshot of how each country controls corruption and is derived from public data from over 120 countries. Building on over 10 years of data collection by ERCAS researchers, the IPI tells a much more granular and objective story about a country’s corruption than a single number can provide. Based on familiar data points like administrative burden, press freedom, and judicial independence, the IPI provides an intuitive glimpse at corruption with an economics twist. While the overall score is a simple average of the six subcomponents, three of those components represent the previously mentioned “corruption constraints” while the others represent “corruption opportunities”. The equilibrium between constraints and opportunities yields each country’s overall score.
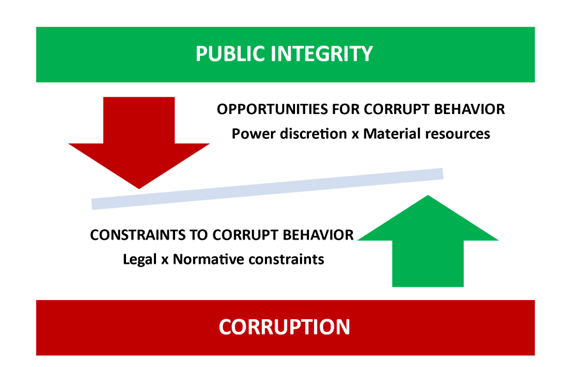
This method of analysis is a novel and peer-reviewed approach for measuring public integrity. “We have a model of public integrity, based on societal enablers and disablers,” explains Mungiu-Pippidi. “One example of an enabler is fiscal transparency, while the lack of many citizens with broadband Internet connections (e-citizens) acts as a disabler.”
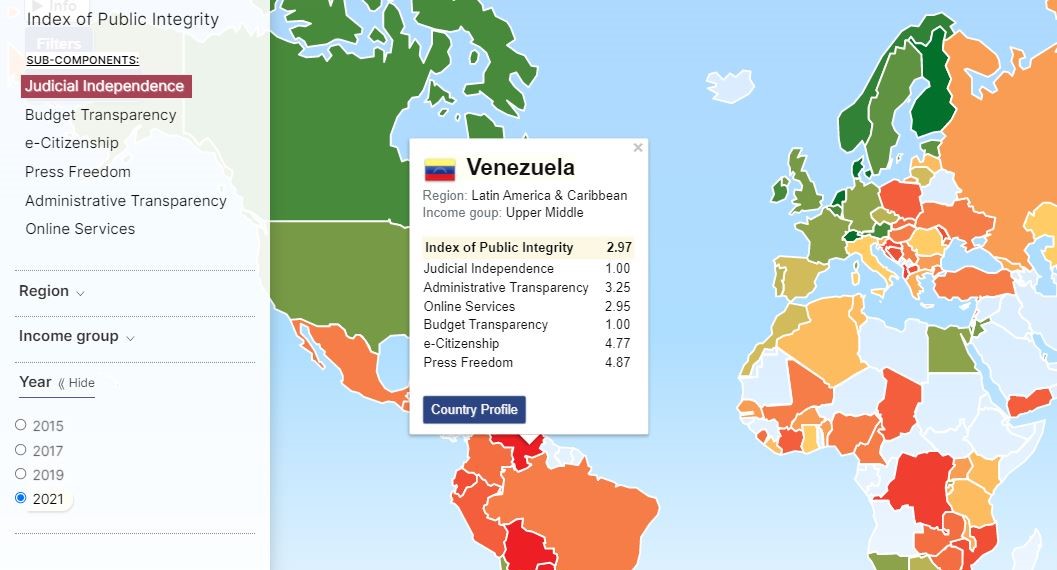
Vividly represented on an interactive world map colored red (low control of corruption) to green (high control of corruption), the IPI can also be viewed as a ranked table or downloaded as a simple spreadsheet.
One-Stop for Public Data
The second view or dashboard is the Transparency Index, or T-Index. Launched just this year, the new index computes a score for over 130 countries based on how much public data each government has promised to share (De Jure) and how much data they actually share (De Facto). As OGP recently put it, “this index allows us to measure the degree to which governments proactively publish core data sets that prior research suggests are important to improving public integrity.”
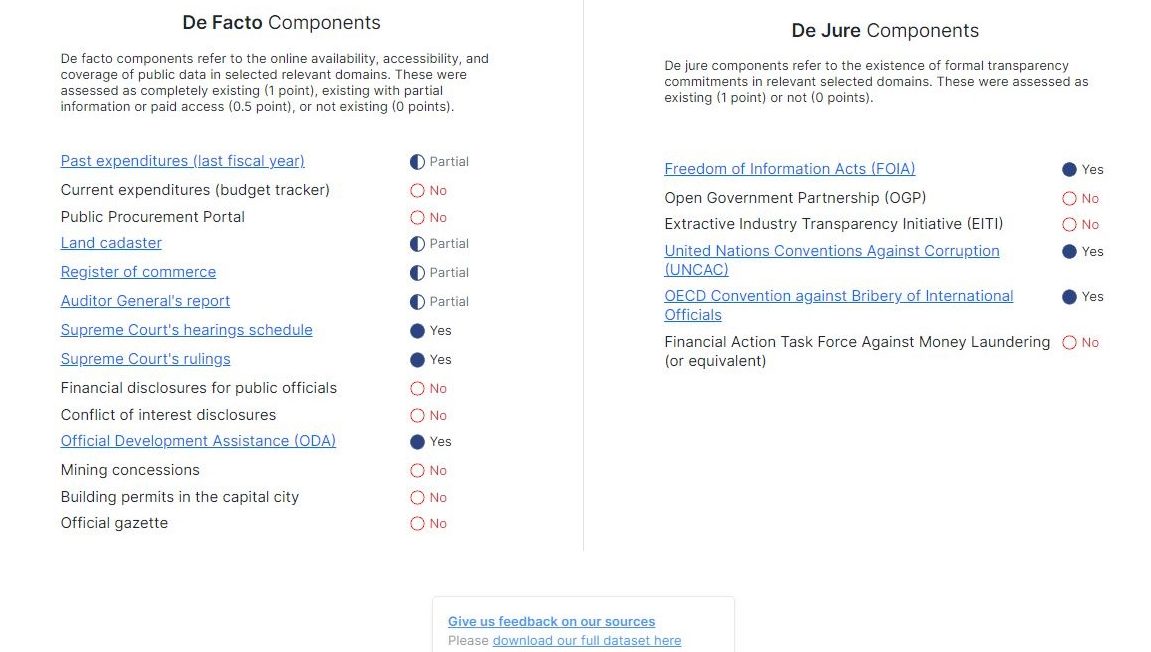
From public and private land registries, to mining concessions, to public procurement portals, the T-Index centralizes an unprecedented amount of public information into a single dashboard. To calculate a country’s score out of 20, the 6 possible De Jure commitments are given either a 0 or a 1, and the 14 possible De Facto data sources are either considered available (a score of 1), partially available (0.5) or unavailable (0). Put them all together for over 130 countries, and the T-Index provides over 2000 links to public data sources and transparency commitments.
These links are provided on each country’s profile page, and the global dataset can be downloaded via a freely available spreadsheet. And for this and other elements of the site, users are invited to provide feedback which will be used to update statistics, help fix errors, or add missing data sources.
Predicting Corruption Risk
The final corruption indicator is the Corruption Risk Forecast itself. This first-of-its-kind corruption tool predicts the direction each country’s corruption risk will move during the next two years. The prediction is derived from a country’s performance in 5 of the 6 IPI components during the past 12 years, and it is moderated by citizen demand for good governance and recent political turning points.
The result is a single figure (increasing, declining, or stationary) representing each country’s expected change in corruption risk. Helpfully, historical performance on the 5 public integrity components can be viewed on each country’s profile page. Like the other two dashboards, the Forecast’s methodology is openly published and its quantitative data is available for download.
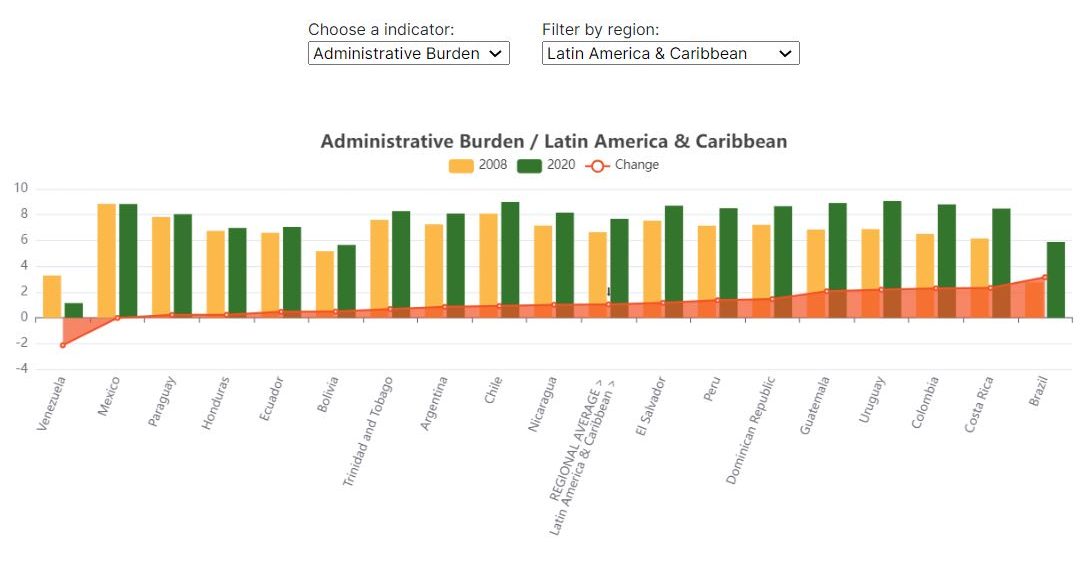
There’s also a tool for regional comparison. Using data from 2008 to 2020, users can compare the absolute and relative performance of countries across six global regions using the five integrity indicators in the forecast. For example, a look at Latin America’s regional performance reveals Brazil to be the fastest improver in reducing administrative burden since 2008. However, despite its speedy advance, Brazil’s administrative burden still comes third-to-last in absolute terms.
 Altogether, by providing a glimpse into the future, the Corruption Risk Forecast provides new information to help guide the agendas of civil society organizations and donors, alert international businesses to investment risks and opportunities, and show governments where their policies are lacking.
A Multi-Use Resource
The CRFs regional and country-by-country analysis tools tell a detailed, forward-looking corruption story that provides something new for everyone. It can be used to inform ethical business choices, encourage integrity-strengthening reforms and interventions, and catch corruption trends early.
“What makes [the CRF] so different is that it’s more based on empirical data than any other index and the only one looking forward rather than looking backward,” says Michael Hershman, co-founder of Transparency International and a board member at CIPE. Given the alarming global events of this year and the rising profile of corruption as a threat to good governance and democracy, looking forward has never been more important.
Ben Schmidt is an Associate Program Officer with the Anti-Corruption & Governance Center at the Center for International Private Enterprise. He has a Master’s Degree in Political Economy and Development.
Hazel Leonard is a Communications Consultant with the Anti-Corruption & Governance Center at the Center for International Private Enterprise. She is currently pursuing a double major in Computer Science and International Relations at Tufts University.
Photo credits: CorruptionRisk.org, ERCAS