
The Corruption Risk Forecast Detects What Other Indices Don’t
In the global fight against corruption, our intuition is often right. We expect countries with faltering governments, fragile institutions, and low per capita incomes to struggle to keep money from going where it shouldn’t—and generally speaking, they do. Likewise, many examples of wealthy countries with strong rule of law and government integrity institutions lead us to associate wealthier states with higher integrity—and data confirms this trend too.
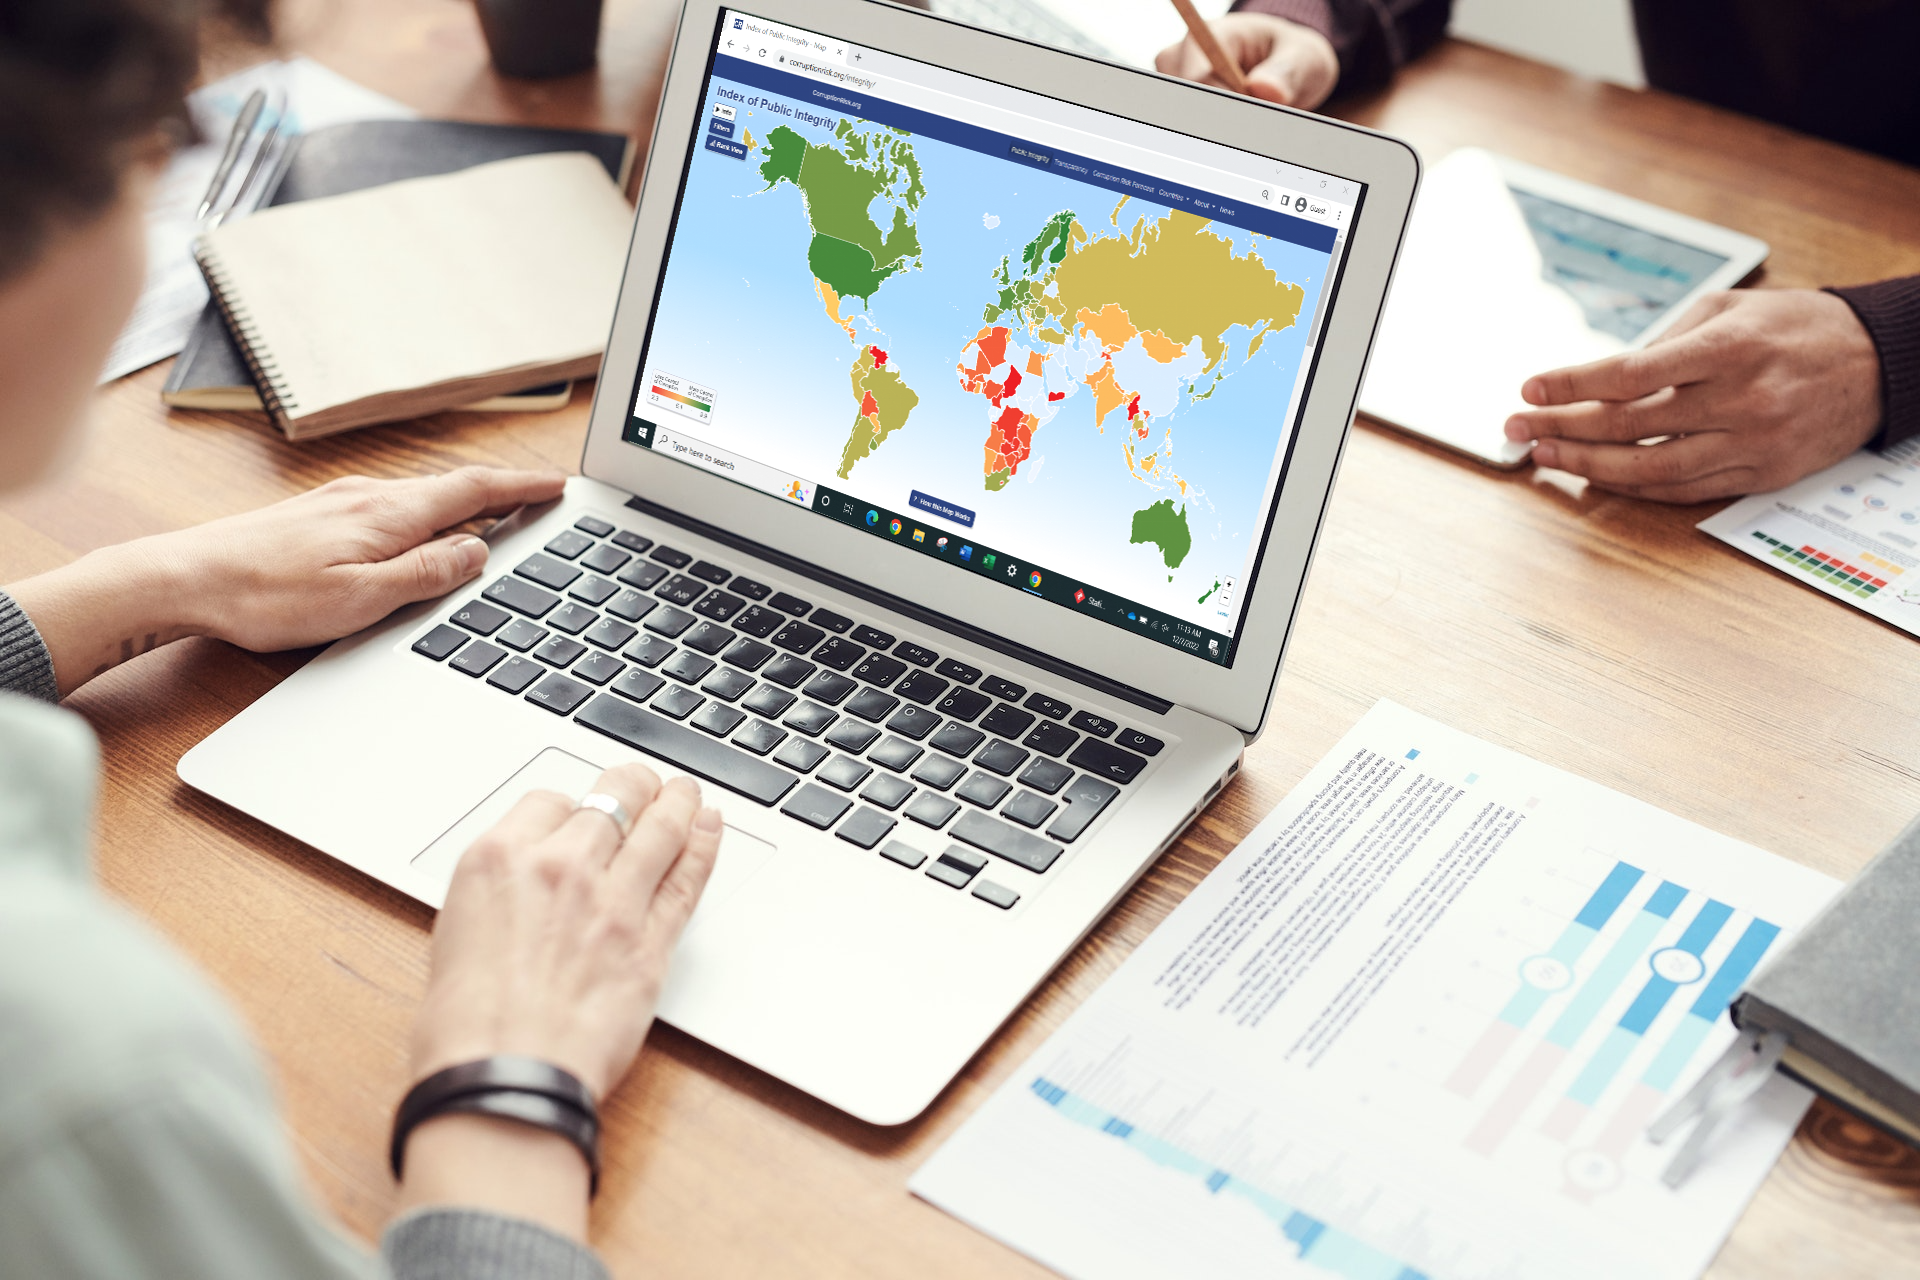
But sometimes, new data challenges our intuition. In the anti-corruption world, nowhere is this more apparent than on the new and free-to-the-public Corruption Risk Forecast (CRF). Launched in April 2022 by the European Research Centre for Anti-Corruption and State-Building (ERCAS) in partnership with CIPE, the CRF offers three global lenses on the state of corruption in over 120 countries: the Index of Public Integrity (IPI), the Transparency Index (T-Index), and the eponymous Corruption Risk Forecast dashboard. Each view provides new and important information about corruption risks around the world.
Let’s start with an example from the IPI. Tracking integrity using over a decade of information collected by ERCAS, the IPI tracks how each country controls corruption. Each overall score is averaged from six easy-to-understand factors like Press Freedom and Judicial Independence, giving users a quick and easy way to identify where corruption risks exist in a country.
The IPI’s wide-lens snapshot of corruption risk includes important information that is missed on other indices. This is evident in the case of Thailand, which received a 35/100 score and a rank of 110 out of 180 countries on the 2021 Corruption Perceptions Index, placing it in the 39th percentile. Similarly, Thailand placed in the 35th percentile in the Control of Corruption category of the World Bank’s most recent Worldwide Governance Indicators. By these measures, Thailand appears institutionally troubled and a big investment risk.
The CRF tells a slightly different story. While the IPI confirms the country’s low relative scores in Administrative Transparency and Press Freedom, it also reveals that Thailand is a high performer in Budget Transparency, Online Services, and e-Citizenship. In fact, on these factors, Thailand surpasses world, income group, and regional averages, and overall reaches the IPI’s 60th global percentile.
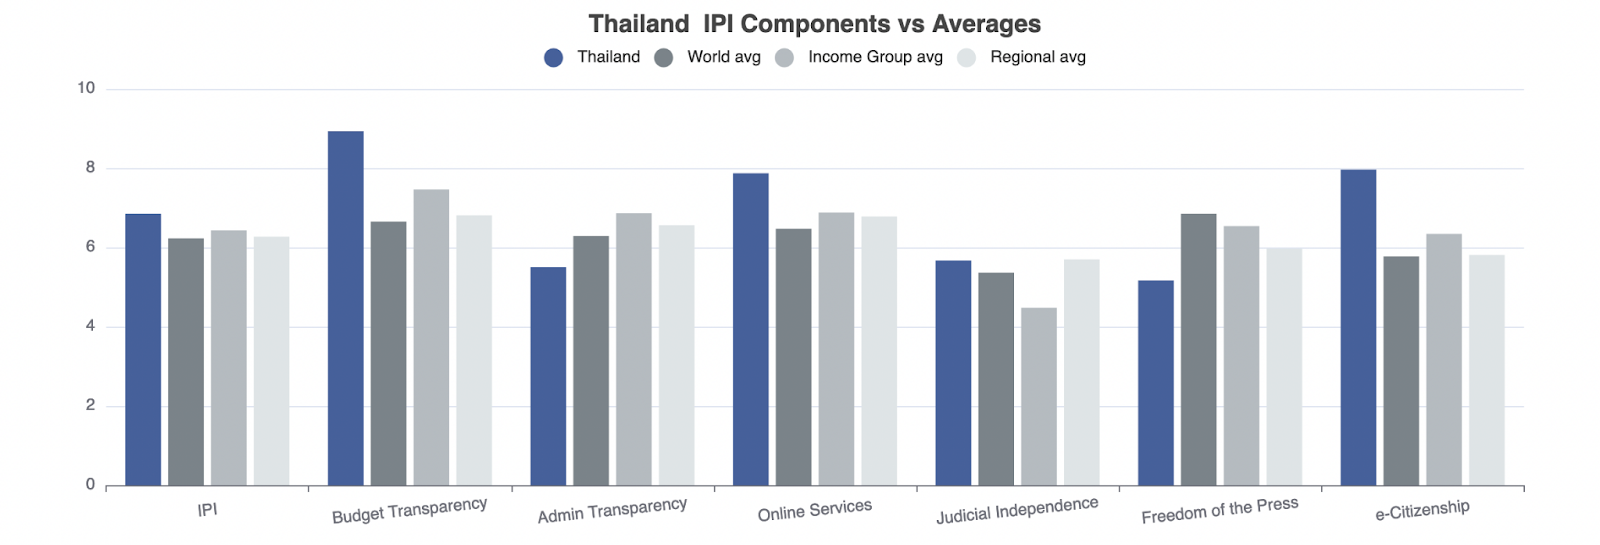
This breakdown corresponds with recent news out of Thailand. Red tape has been reduced and transparency has risen, culminating in big businesses like national extractives company PTTEP pledging to make anti-corruption commitments.
Surprising Secrecy
The biggest takeaways from the Corruption Risk Forecast’s second dashboard, the Transparency Index (T-Index), might be how many countries with high integrity scores fail to release public data. Even more surprising is how many ostensibly high-integrity countries have promised to share information—but don’t.
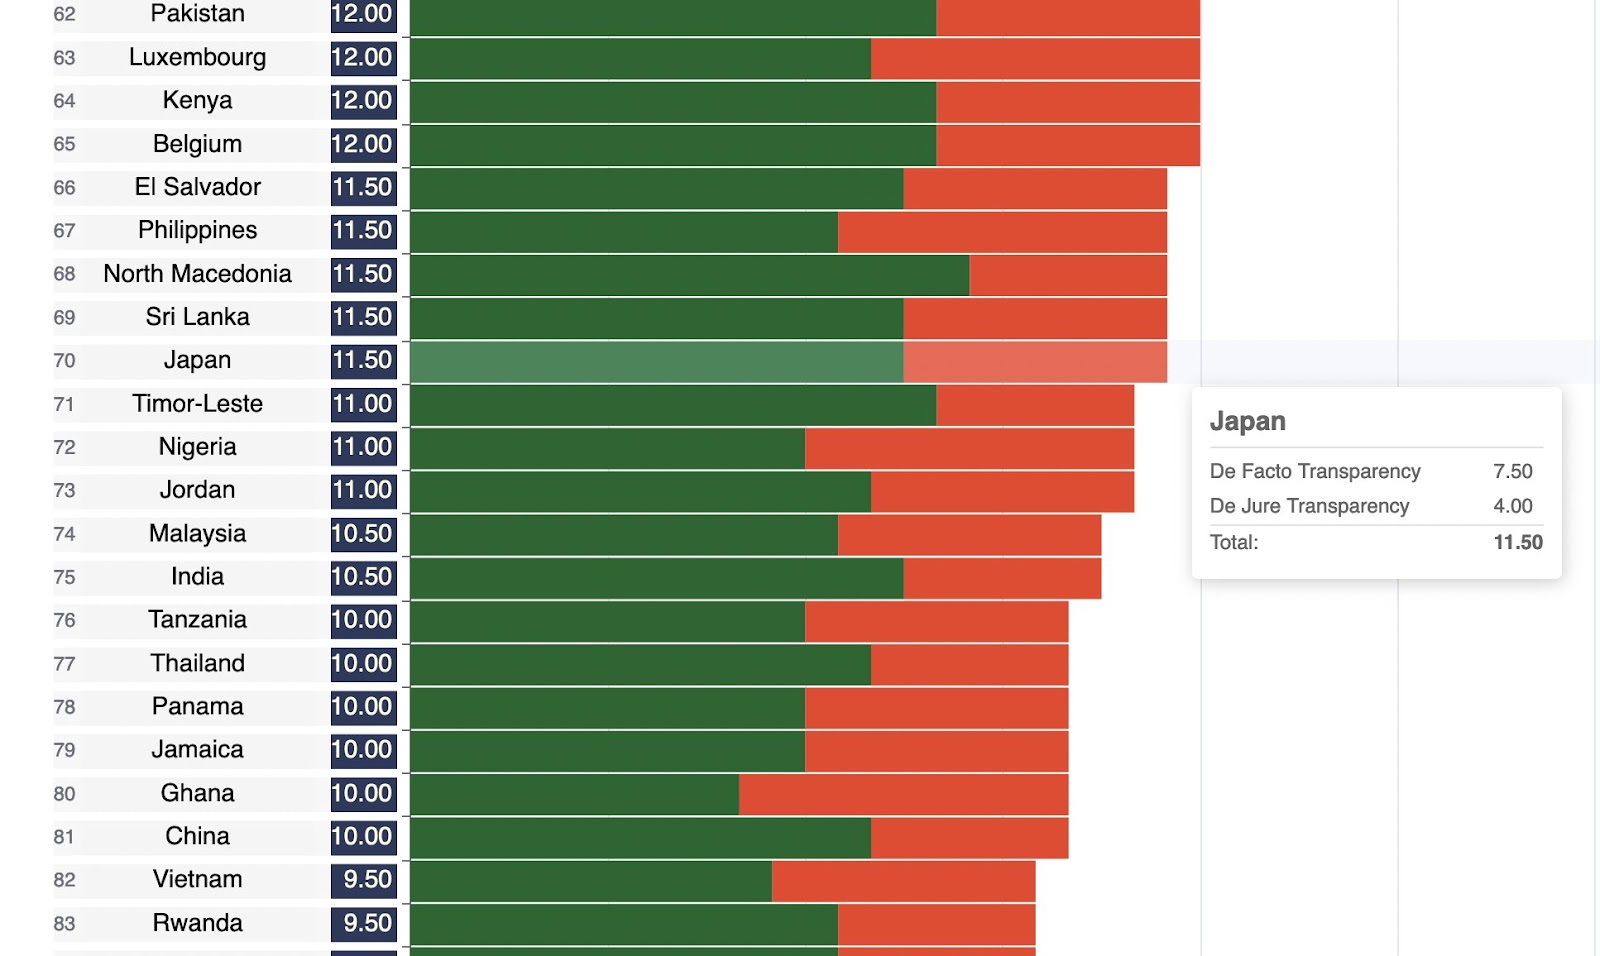
For example, Japan scores 8.01 on the IPI—or 22nd out of 114 countries—but its T-Index scores are mixed. To review, the overall T-Index score is calculated by measuring how much public data each government has promised to share (De Jure, 5 possible points) and how much data it actually shares (De Facto, 14 possible points).
Japan’s overall T-Index score is 11.5 out of 19—or 70th out of 129 countries—far below expected based on its income and IPI score. Looking closer, Japan doesn’t score low because it has failed to make commitments. It has signed major transparency commitments in freedom of information, financial transparency, and anti-bribery. Rather, its De Facto score of 7.5/14 reflects a failure to disclose public officials’ financials or conflicts of interest.
In light of Japan’s recent Olympic bribery scandal, which involved both public and private actors, this lack of transparency could be an indicator of lurking corruption problems that are invisible on other indices.
Early Detection
Does strong performance on the T-Index and IPI today mean a country’s anti-corruption success will continue tomorrow? Will states struggling to control corruption still struggle in the future?
The eponymous Corruption Risk Forecast dashboard helps answer these questions. This forward-looking tool combines a country’s IPI performance with recent political turning points to calculate the direction its corruption risk will move in the next two years.
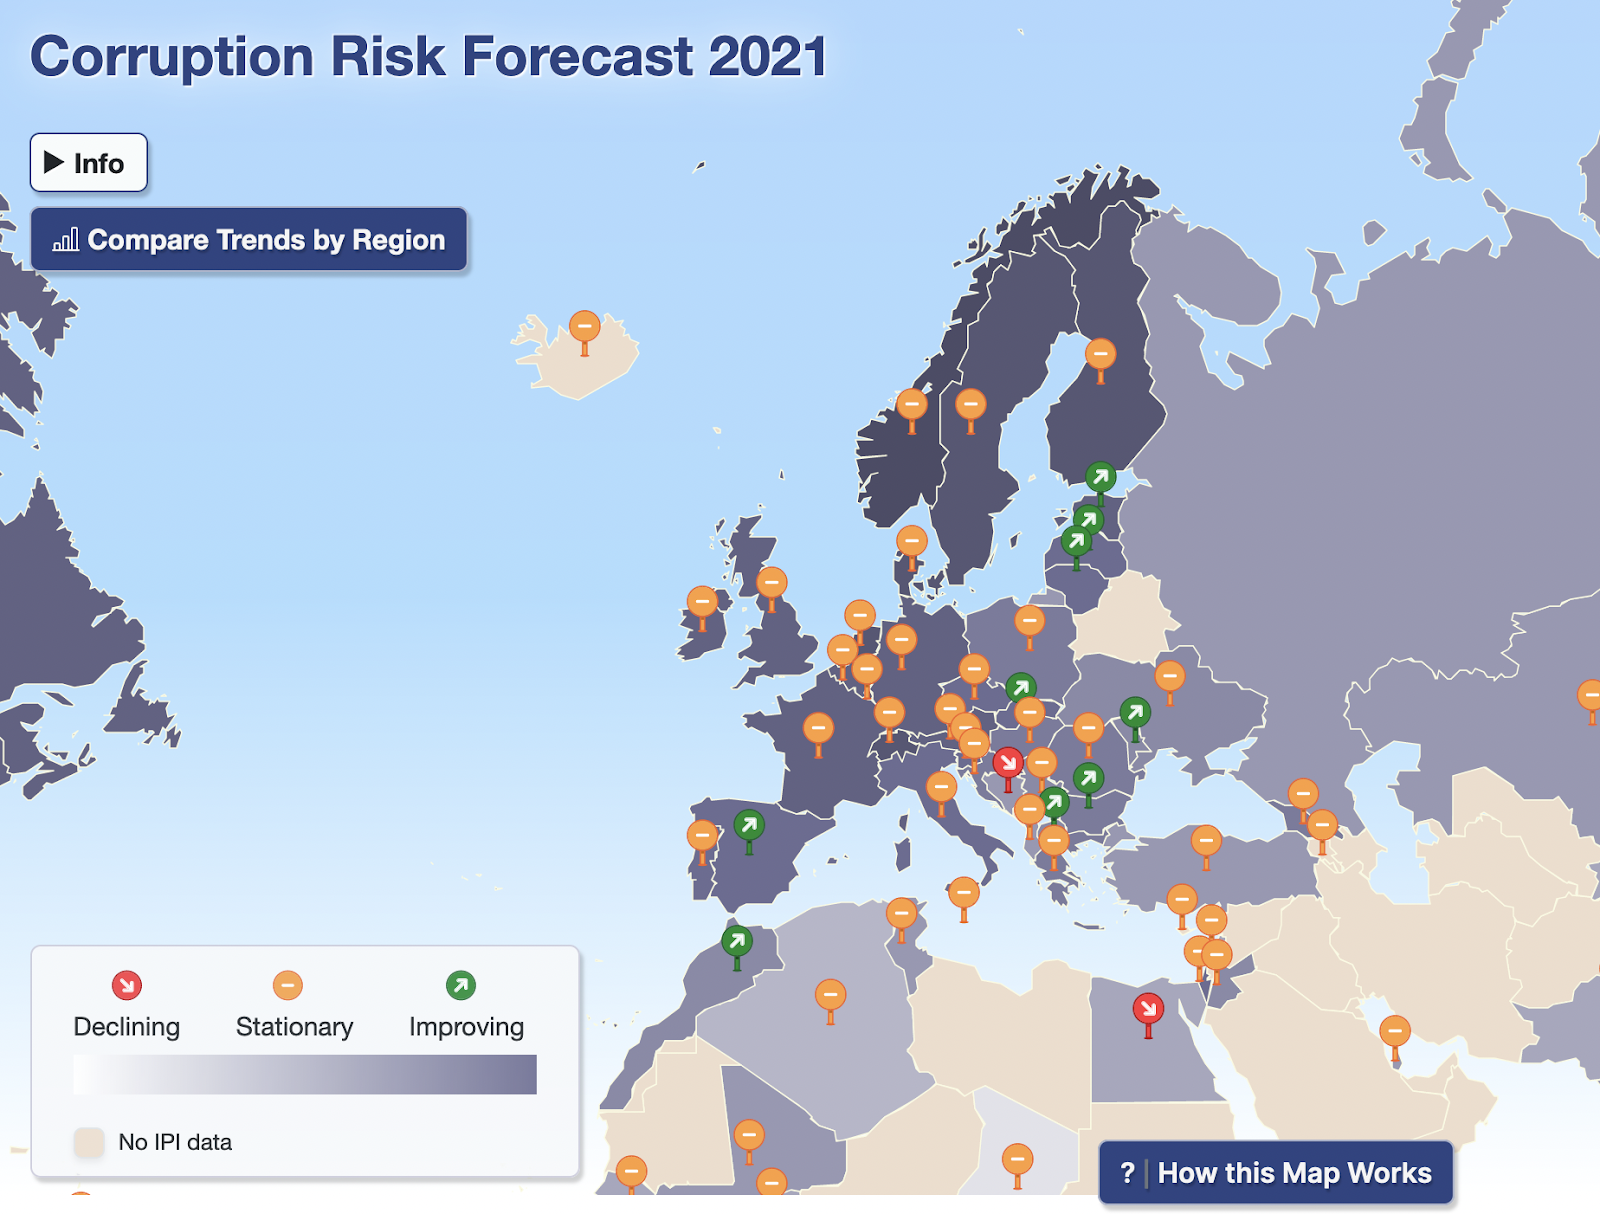
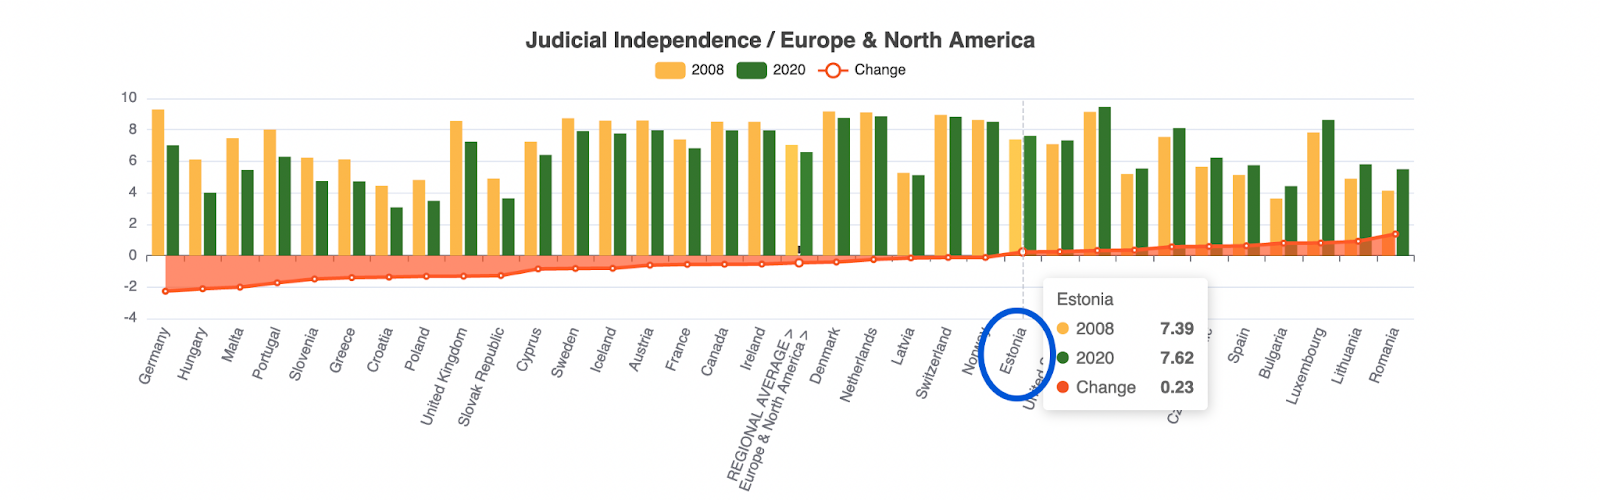
In Europe, green “Improving” arrows over the Baltics—Estonia, Latvia, and Lithuania—set the countries apart from their mostly “Stationary” neighbors. Clicking on Estonia’s Country Profile reveals how the country’s recent past reflects its future, achieving “the world’s most successful short transition to good governance” according to the forecast summary. The country’s IPI data, shown below on a regional comparison chart, shows how it continues to beat the European average in improvements to Judicial Independence & Administrative Burden.
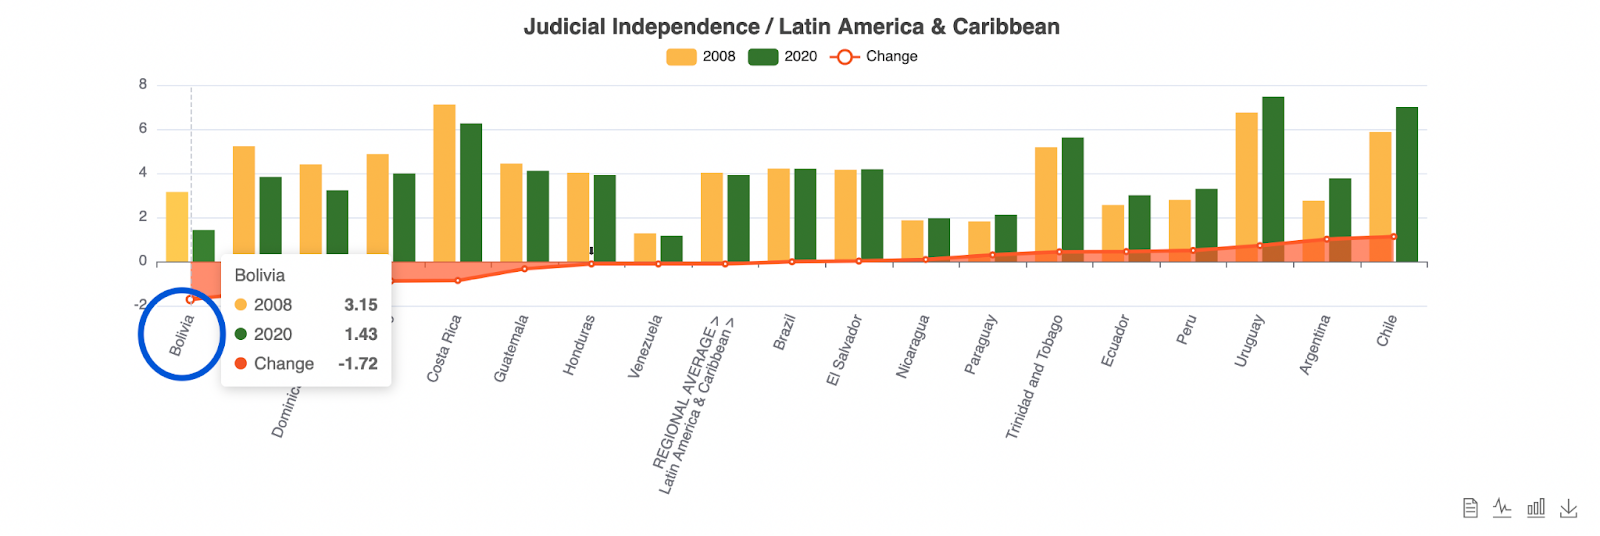
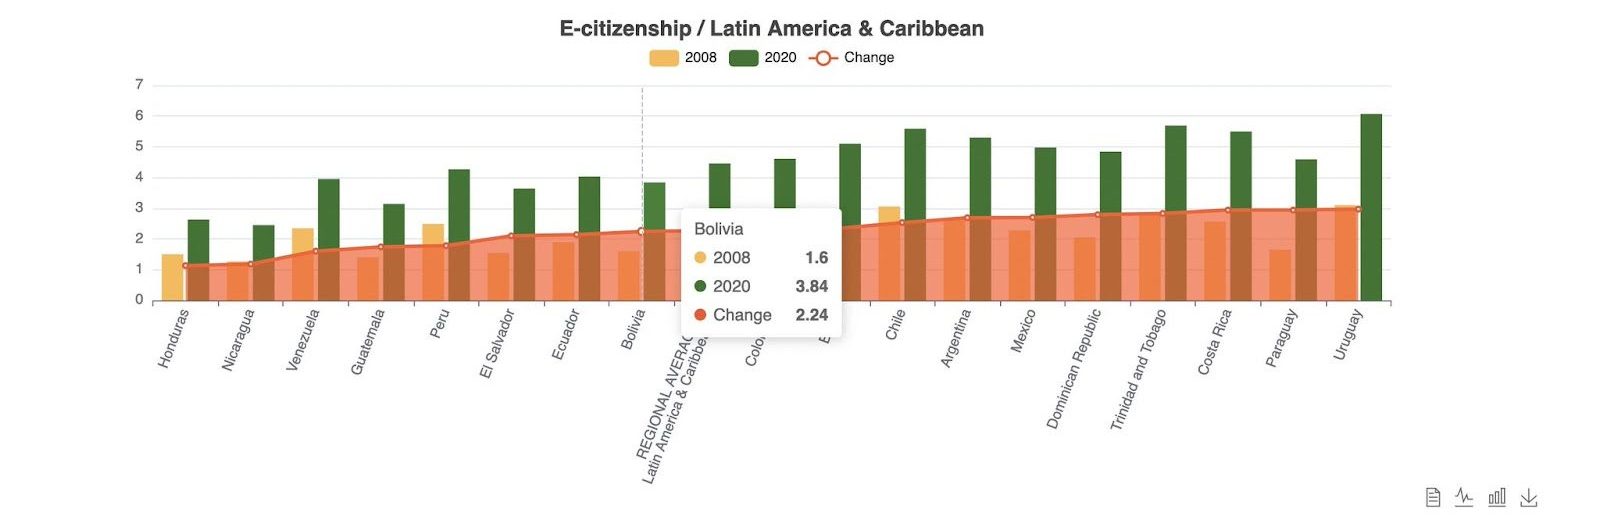
As the examples above show, the CRF Map View is complemented by a Compare Trends by Region view that visualizes how countries compare to others in their region, income group, or around the world. Zooming in on states in Latin America and the Caribbean contextualizes Bolivia’s performance, which is at the tail end of the region.
`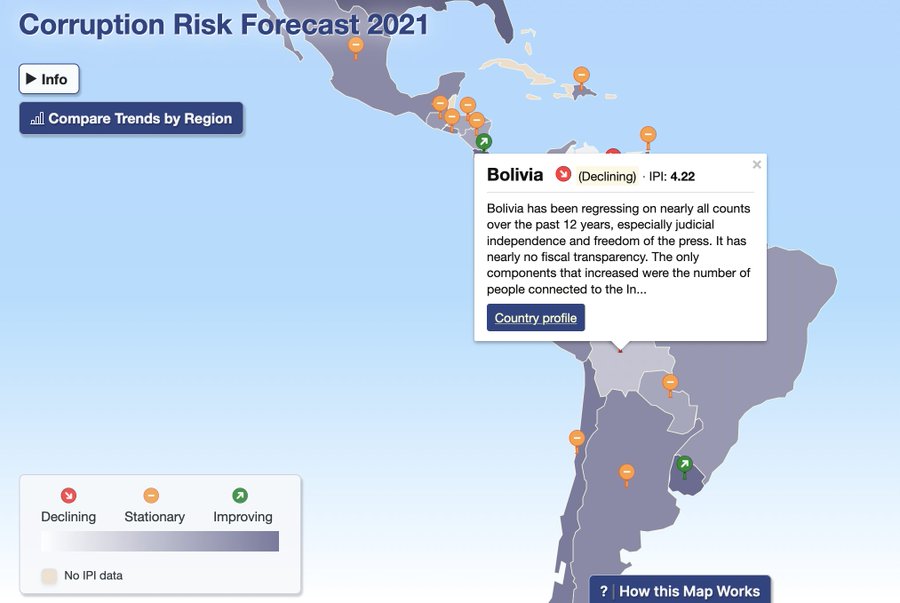
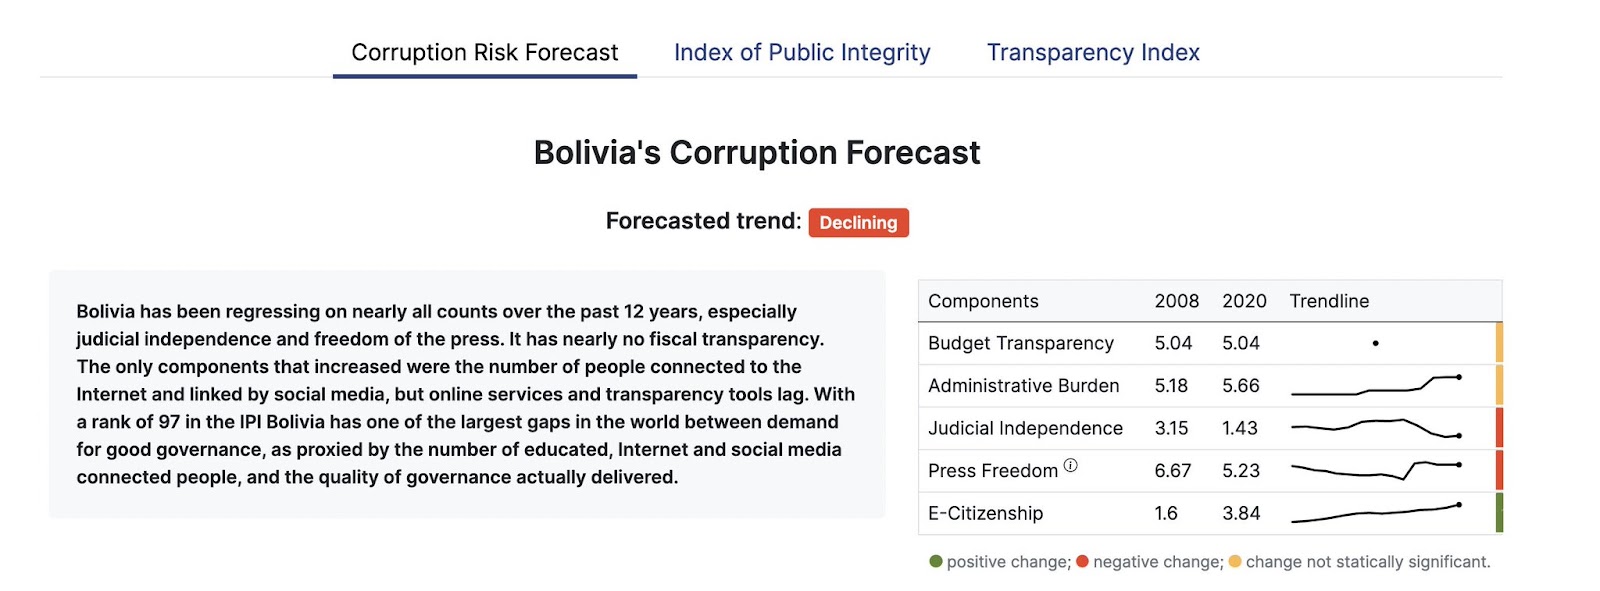
Reinforcing its “Declining” forecast, Bolivia has seen a significant downturn in almost all IPI categories since 2008, including the region’s sharpest drop in Judicial Independence, as you can see in the regional comparison below.
The one exception to the country’s sagging integrity scores is steady gains in E-Citizenship. While improvement is a consistent global trend, Bolivia’s growth in active digital citizens punches above its regionally low income, development, and integrity scores. Its relative strength in this area has helped attract investments in digital technology from China and the EU. For donors and activists, Bolivia’s E-Citizenship trend highlights an opportunity to push for greater integrity and transparency by leveraging digitally connected citizens.
Actionable Insights
These examples highlight how the CRF and its three dashboards provide new, intuition-challenging insights about corruption risk. To review, the IPI lays out each country’s institutional enablers and disablers of corruption; the T-Index highlights commitment to and often selective release of public data; and the CRF takes insights from these indices and recent political events to paint a picture of the most likely future.
Together, these tools offer what most governance indices don’t: actionable guidance to citizens, businesses, and government leaders. Armed with an understanding of each country’s unique combination of corruption risk factors—from transparency and rule of law to citizen checks on power—the CRF helps change-makers set their agendas and gives investors more strategic information about risks and opportunities.
New updates are also on the way. In addition to the recently added country comparison tool, an updated 2022 dataset and forecast will be released in early 2023. With each new addition, CIPE and ERCAS hope to encourage better-informed action by government and civil society against corruption. At the same time, CIPE hopes businesses will use this tool to capitalize on new opportunities and lower exposure to lurking corruption risks in their dealings around the world.
Image Credit: Pexels