
Corruption Risk Forecast is the Goldilocks Solution that Business and Policymakers Need
As a member of a community of corruption fighters, the Anti-Corruption & Governance Center at the Center for International Private Enterprise (CIPE) applauds the success of existing corruption measurement tools while staying committed to developing new anti-corruption measures and sharpening existing ones. CIPE recently collaborated with the European Centre for Anticorruption and Statebuilding (ERCAS) to build and refine a new set of corruption indicators – The Corruption Risk Forecast (CRF). This tool fills a gap by providing private- and public-sector decisionmakers with an accessible model of corruption risk, relevant policy recommendations, and a forward-looking corruption forecast.
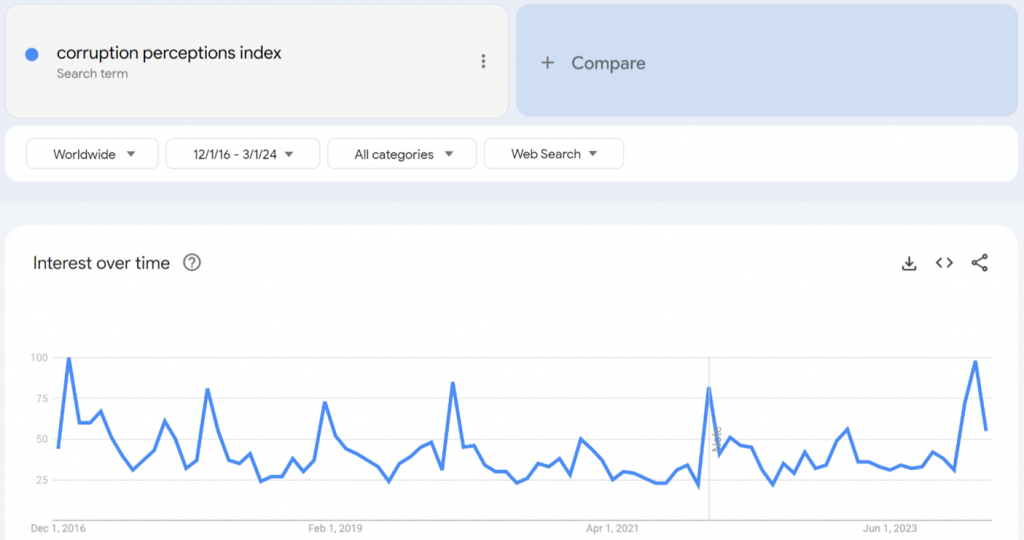
Each year, updates to Transparency International’s well-known Corruption Perceptions Index (CPI) spur a global wave of discussion about corruption. The updated rankings spark media conversations in dozens of countries and frequently elicit comments from political and civil society leaders. A glance at Google Trends data shows just how significant an impact these annual releases have on internet searches around the world.
The CPI’s simple ranking approach is part of its strength – and so is its basis on a set of expert assessments. However, when anti-corruption efforts uncover corruption scandals, perceptions of corruption can rise at the very moment when corruption itself is going down. CPI rankings may also be too general to provide actionable insights to an investor deciding between expanding to Country A or Country B, or to a policymaker trying to select the most effective anti-corruption reform. As a result, decision-makers often seek out other corruption measures for guidance.
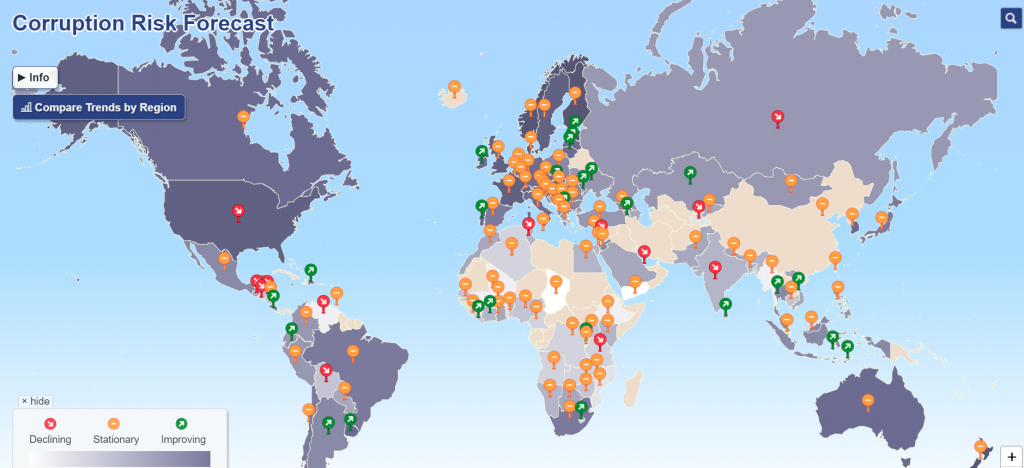
The Corruption Risk Forecast (CRF) is such a measure. Produced by a partnership between CIPE and the European Research Centre for Anticorruption and Statebuilding (ERCAS), the CRF calculates corruption risk for over 120 countries by balancing the strength of corruption-reducing institutions. Uniquely, the CRF also uses ten-year data trends and a peer-reviewed political check to forecast whether corruption risk will rise, fall, or remain steady over the next two years. Altogether, the CRF strikes a distinctive balance between simplicity, objective data, and future estimates based on ten-year data trends to calculate corruption risks for over 120 countries.
A New Corruption Lens
The CRF joins a growing field of alternative corruption measures. Sophisticated indices like the World Bank’s Control of Corruption indicator and the subscription-only Global Corruption Index produced by the Swiss firm Global Risk Profile provide insight into policy questions affecting corruption. V-Dem’s Political Corruption Index, arguably the most complex of all global corruption indicators, draws from over a hundred indicators covering four branches of government and six distinct types of corruption.
The CRF adds to these existing tools by providing an intuitive snapshot of corruption risk that does not require measuring corruption directly. Instead, the CRF’s peer-reviewed theory of corruption risk measures the ability of each country’s institutions to keep corruption at bay. Put another way, if corruption is the abuse of entrusted power for personal gain, the CRF tracks the extent to which countries constrain or fail to constrain power over exploitable resources.
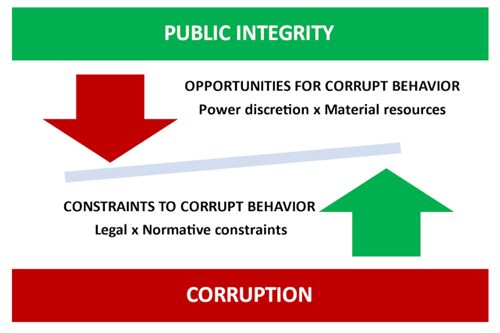
When constraints (like a free press and a fair justice system) are strong, corruption risks fall. When opportunities (like opaque or unaccountable public processes) are plentiful, corruption risks increase. A country’s overall corruption risk is found at the equilibrium between these corruption activators and constraints.
With this theory as its foundation, the CRF uses three indexes to score countries:
(1) The Index of Public Integrity, or IPI, measures the strength of six corruption-limiting institutions.
(2) A Transparency Index, or T-Index, measures government commitment to and current availability of transparent public data – one of the most vital constraints to corruption.
(3) The Corruption Risk Forecast uses ten-year trends from the IPI and a peer-reviewed gauge of political willingness to enact anti-corruption reforms to estimate how corruption is expected to change in each country over the next two years.
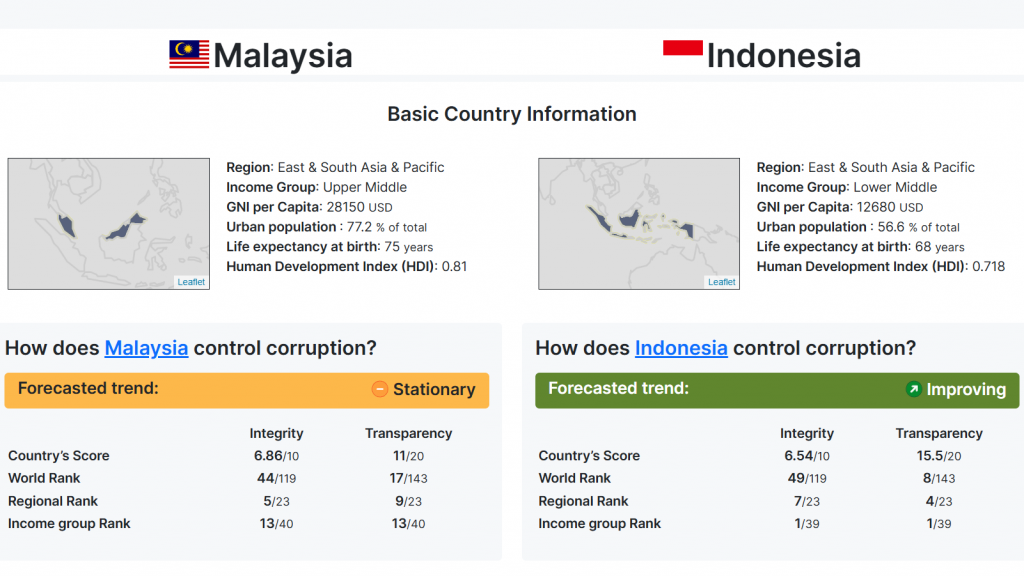
Country performance on all three measures can be summarized side-by-side using the site’s country comparison tool: the full CRF forecast in the colored bars, and the integrity and transparency indexes just below them.
Finally, the CRF stands out as the only measure to provide a forward-looking perspective on corruption risk. With its annually updated, free-to-the-public forecasts, the CRF provides valuable trend analysis to business leaders and investors about their global investments—highlighting opportunities, identifying threats, and providing comparison tools unavailable from any other measure.
South Africa – Improving or Regressing?
Recent corruption risk changes in South Africa illustrate the CRF’s value. The 2023 CPI scored South Africa at its lowest-ever score of 41. On the CRF, however, South Africa appears to have slightly reduced its corruption risk by improving from its 2021 IPI score of 7.39 to 7.51 in 2023.
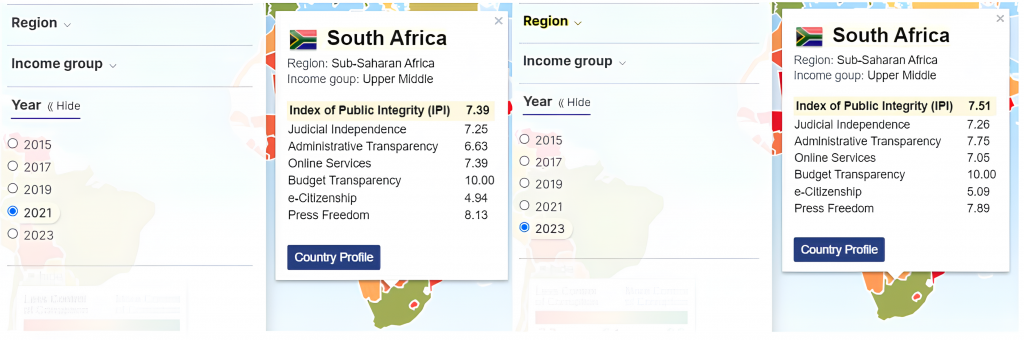
A closer look at changes in the CRF’s IPI factors reveals that there were four changes in the country’s IPI factors – two positive and two negative. While budget transparency and judicial independence held steady, press freedom fell from 8.13 to 7.89 and online services fell from 7.39 to 7.05. At the same time, administrative transparency improved from 6.63 to 7.75 and e-citizenship rose slightly from 4.94 to 5.09.
While these changes together are not significant enough to forecast a change in the country’s corruption trajectory over the next two years, the CRF’s more-granular signals of progress and decline offer danger signs to businesses and illustrate policy implications for reformers and corruption-fighters.
Corruption Awareness Needs Corruption Diagnosis
In a perfect world, popular corruption indicators would also give clear and easy-to-understand policy guidance to governments to help them reduce their corruption risks and improve their attractiveness to foreign investors. Currently, corruption risk trackers like the CPI provide accurate information about overall corruption levels but lack a more holistic and instrumental view of the underlying factors that drive and increase the likelihood of corruption. More complex corruption trackers like those provided by V-Dem and the World Bank take a data-heavy approach to tracking corrupt behavior more directly.
The CRF provides a Goldilocks solution. Between the IPI, T-Index, and forecast, the CRF provides a curated set of relevant data, analyzed over time, to provide a clear picture of current corruption risks, future corruption risks, and public data transparency. For each country, the CRF provides a short summary of how corruption risks have evolved, where corruption constraints are lacking, and what policymakers can do to address them.
For corruption fighters, investors, and reformers, the first step to better action is better information. With its accessible, policy-specific, and forward-looking corruption risk tools, the Corruption Risk Forecast brings much-needed insights to bear on one of the world’s most pernicious problems.